Performance, Optimization & Memory
Published on · Updated · 4 min
Do you have a production app with performance issues? This service helps you:
Diagnose — precisely identify bottlenecks
Measure — establish baselines and objective metrics
Optimize — apply targeted and effective fixes
Monitor — set up tracking to prevent regressions
“This service addresses concrete problems. I profile, analyze, and fix.”
Symptoms I Treat
Your app might be suffering from:
| Symptom | Probable Cause | User Impact |
|---|---|---|
Freezing UI | Blocked main thread | Frustration, abandonment |
Choppy scrolling | Heavy cells, layout | Degraded experience |
Slow launch | Excessive initialization | Poor first impression |
Battery drain | Background tasks, CPU | Uninstallation |
Memory explosion | Retain cycles, caches | Crashes |
Overheating device | Overloaded GPU/CPU | Device throttling |
My Methodology
1. Baseline & Reproduction
Before optimizing, we need to measure:
Systematic problem reproduction
Documented initial metrics
Defined test scenarios
Target devices identified (old iPhone vs recent)
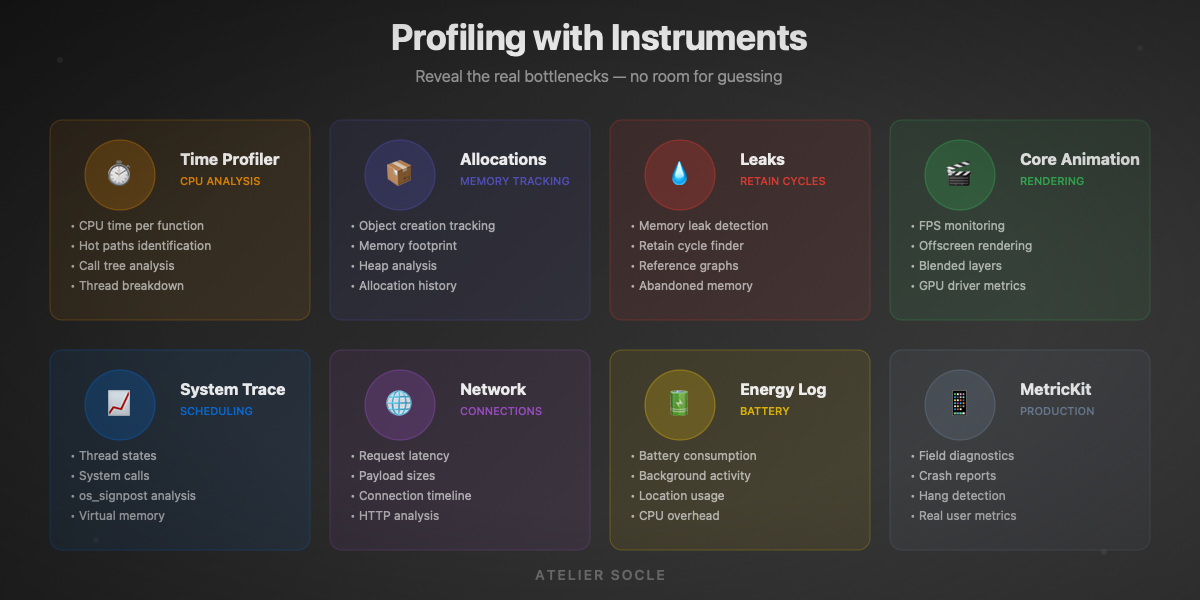
2. In-depth Profiling
Analysis with Apple tools:
| Tool | What It Reveals |
|---|---|
Time Profiler | CPU time per function, hot paths |
Allocations | Created objects, allocated memory |
Leaks | Retain cycles, memory leaks |
System Trace | Scheduling, thread states |
Core Animation | FPS, offscreen rendering |
Network | Latency, payload sizes |
Energy Log | Battery consumption |
3. Analysis & Prioritization
Not all optimizations are equal:
User impact (visible vs invisible)
Fix effort (quick win vs refactor)
Regression risk
Overall ROI
4. Targeted Fixes
Optimizations applied by priority:
Quick fixes first (low-hanging fruits)
Localized refactoring if needed
Non-regression tests
Gain validation
5. Documentation & Monitoring
To make it last:
Detailed optimization report
Before/after metrics
Automated performance tests
Monitoring recommendations
Optimization Domains
CPU & Main Thread
The main thread must stay free for UI.
Common problems:
- Heavy computations on main thread
- Synchronous JSON parsing
- Complex layouts recalculated in loops
- Poorly managed observers
Solutions:
- Dispatch to background queues
- async/await and Swift Concurrency
- Lazy loading and pagination
- Layout caching
Memory & Retain Cycles
Memory is precious, especially on older devices.
Common problems:
- Closures capturing self strongly
- Unbounded caches
- Uncompressed images in memory
- Strong delegates
Solutions:
- Systematic [weak self]
- NSCache with policies
- Image downsampling
- Weak delegates
Rendering & Animations
60 FPS or nothing.
Common problems:
- Offscreen rendering (shadows, masks)
- Overlapping transparencies
- Non-optimized images
- Animations on main thread
Solutions:
- Rasterization when appropriate
- shouldRasterize, drawsAsynchronously
- Optimized assets (@2x, @3x)
- Core Animation vs UIView.animate
Network & Data
Perceived latency matters as much as actual latency.
Common problems:
- Sequential requests
- Oversized payloads
- No caching
- No pagination
Solutions:
- Parallel requests
- Compression, selective fields
- URLCache, application cache
- Infinite scroll, lazy loading
Tools I Use
Apple Instruments
The complete Xcode profiling suite:
Time Profiler, Allocations, Leaks
System Trace, os_signpost
Core Animation, GPU Driver
Network, Energy Diagnostics
Automated Measurements
Performance tests integrated into CI:
XCTest
measure {}blocksMetricKit for field metrics
Custom benchmarks
Regression detection
Production Monitoring
Post-deployment tracking:
Firebase Performance Monitoring
MetricKit reports
Crash reports (memory)
Custom analytics
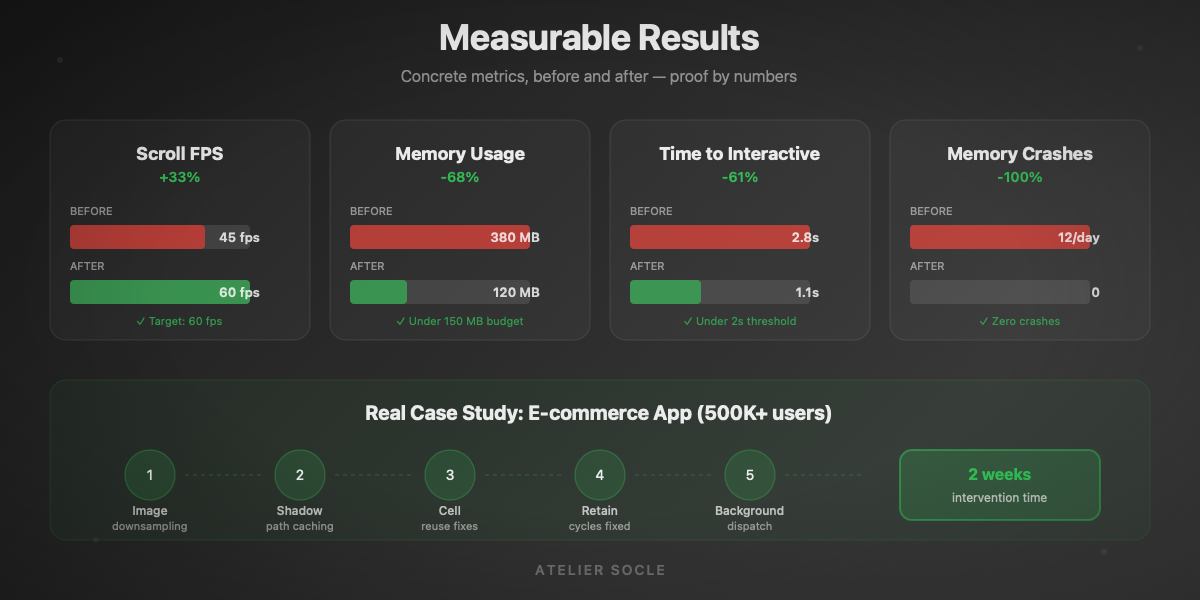
Mission Example
Context
E-commerce app with 500K+ users, complaints about slowness on the product feed.
Diagnosis
Scroll at 45 FPS (target: 60)
Images loaded at full resolution
Shadows computed every frame
3 retain cycles identified
Optimizations
Image downsampling to display size
Pre-calculated shadow paths
Properly reused cells
Fixed retain cycles
Results
| Metric | Before | After | Gain |
|---|---|---|---|
Scroll FPS | 45 | 60 | +33% |
Feed memory | 380 MB | 120 MB | -68% |
Time to interactive | 2.8s | 1.1s | -61% |
Memory crashes | 12/day | 0 | -100% |
Engagement Formats
Performance Audit
Complete diagnosis with recommendations.
Deliverables:
Detailed profiling report
Identified and prioritized issues
Optimization recommendations
Effort estimation
Duration: 3-5 days
Optimization Sprint
Diagnosis + fixes on a defined scope.
Deliverables:
Initial audit
Implemented optimizations
Performance tests
Documented gains
Duration: 1-2 weeks
Continuous Support
Long-term performance monitoring.
Deliverables:
Perf-oriented PR reviews
Monitoring setup
Team training
Regression alerting
Duration: 1-3 months
Principles I Apply
“Premature optimization is the root of all evil”
Measure before optimizing — no guesswork
Profile on real devices — the simulator lies
Target hot paths — 80/20 rule
Test on older devices — iPhone 8, not iPhone 15
Automate benchmarks — prevent regressions
Document choices — for future maintenance
The boundaries of this service
- Not an architecture overhaul → see Swift Architecture
- Not feature development → see Apple Applications
- Not theoretical consulting → see Technical Coaching
Here, we solve proven performance problems with measurable results.
Frequently Asked Questions
"How do I know if I need this service?"
If your users complain about slowness, if your app crashes for memory reasons, or if you see poor ratings related to performance — you probably need an audit.
"Will this break features?"
Optimizations are targeted and tested. We don't touch functionality, only how it executes.
"How much gain can we expect?"
It depends on the initial state. I've seen 50-80% gains on apps that had never been profiled. On already optimized apps, gains are more modest but often still significant.
"What if the problem is backend-side?"
I can identify whether the problem comes from the client or server. If it's the backend, I provide you with data so your backend team can investigate.